Summarize This Article With AI
Most SEOs obsess over rankings, backlinks, and content. And fair enough, those things matter. But there’s a layer of data sitting on your server right now that very few people bother to look at, and it holds some of the most honest information you’ll ever get about how your site is actually performing.
We’re talking about your log files.
If you’ve never touched one, don’t panic. Log file analysis sounds intimidating, and the raw data itself looks like something a developer would cry over. But once you understand what you’re looking at, it becomes one of the most powerful tools in a technical SEO audit.
This guide will walk you through everything: what log files are, why analyzing them matters for SEO, how to access them, what to look for, and which tools make the process less painful.
Let’s get into it.
Article Summary
- Log files are your server’s diary. They record every request made to your site, whether from real users or search engine bots, including Googlebot.
- Log file analysis reveals how search engines crawl your site, not just what Google Search Console estimates, but the real, unfiltered bot behavior.
- Key insights include crawl frequency, crawl budget waste, orphan pages, error-heavy URLs, and pages Google is ignoring entirely.
- Access logs are the most relevant log type for SEO, recording IP addresses, user agents, timestamps, requested URLs, and HTTP status codes.
- Several tools, ranging from free manual options to dedicated SEO log analyzers, can help you make sense of raw log data efficiently.
- Log file analysis is not a one-time task. It should be a recurring part of your technical SEO monitoring, particularly for larger and frequently updated sites.
What Is Log File Analysis?
Log file analysis is the process of downloading and reviewing the data recorded in your server’s log files to understand how users, bots, and search engines are interacting with your website.
Here’s the simplest way to think about it.
Every time someone visits your site, whether that’s a human clicking from Google or Googlebot crawling a page, your web server creates a record of that request. It notes the time, the URL requested, the response code, the user agent making the request, and the IP address it came from. All of those records are stored in a log file.
Log files are, essentially, your server’s diary.
And like any good diary, they tell you things you wouldn’t find out any other way.
Log file data shows crawlers’ true behavior, which is something no third-party SEO tool can replicate. Google Search Console gives you crawl estimates and sampled data. Log files give you the full, unfiltered picture of exactly which URLs Googlebot visited, when it visited them, and what it found.
That distinction matters more than most people realize.
Why Log File Analysis Is Important for SEO
There’s a reason experienced technical SEOs treat log files as a primary data source rather than a secondary check. The insights they surface are not available anywhere else.
Here’s what analyzing your log files actually tells you.
Crawl Budget Optimization
Crawl budget refers to the number of pages Google will crawl on your site within a given time period. On larger sites with thousands or millions of pages, this is a finite resource, and wasting it on low-value pages means important pages get crawled less frequently, or not at all.
Log file analysis is the only way to see exactly where Googlebot is spending its time.
You might discover it’s repeatedly crawling faceted navigation pages, filtered parameter URLs, or thin content that adds zero value to your site’s indexation. That’s your crawl budget going to waste. Once you identify those patterns in your log data, you can use robots.txt, canonical tags, or noindex directives to redirect Googlebot’s attention where it actually belongs.
Detecting Crawl Errors
Googlebot doesn’t always shout when something goes wrong. A 404 error in your log files might represent a URL that was linked to internally, that bots visit regularly, and that has never been redirected. That’s a signal that your internal link structure has broken pathways that need fixing.
Log file analysis helps you find these issues at scale, not as a sampled estimate, but as real frequency data showing exactly how often Googlebot is hitting error URLs.
Finding Orphan Pages
An orphan page is a page on your site with no internal links pointing to it. No internal links means Googlebot has no natural path to discover it. But here’s the thing: it might still appear in your log files, crawled from an old external link or XML sitemap.
Cross-referencing your log data against a site crawl is one of the most effective ways to surface orphan pages that would otherwise be completely invisible in your audit process.
Spotting Bot Behavior Anomalies
Unusual spikes in crawl frequency, bot activity from unexpected IP addresses, or requests to resources you’d expect to be excluded from crawling — all of these show up clearly in log file data. Analyzing logs helps you detect patterns that might indicate bot traps, crawl loops, or even malicious scraping activity hitting your server.

How to Access Your Log Files
This is where many SEOs get stuck.
Accessing your log files isn’t complicated, but the process varies depending on your server setup and hosting environment.
From Your Hosting Control Panel
If your site is hosted on cPanel or Plesk, you can often reach the access logs directly through the hosting dashboard. Look for a “Logs” or “Metrics” section. Some hosts store logs in a dedicated directory on your server, typically something like /var/log/apache2/ for Apache or /var/log/nginx/ for Nginx.
From Your Server Directly
If you have SSH access, you can access log files directly via the command line. For an Apache server, the command would typically be something like tail -f /var/log/apache2/access.log. For Nginx servers, the path is usually /var/log/nginx/access.log. Your developer or hosting provider should be able to point you to the exact file path if you’re unsure.
From Your CDN or Cloud Provider
If your site runs through a CDN like Cloudflare, Fastly, or AWS CloudFront, your origin server logs may not capture all requests. Instead, you’ll need to access logs from within your CDN’s dashboard. Cloudflare, for example, offers log streaming for enterprise plans. AWS stores access logs in S3 buckets.
Always be specific when requesting logs from a developer. Ask for access logs, not error logs, not system logs. Access logs are the ones that record HTTP requests, which is exactly what you need for SEO analysis.
One important note: log files contain IP addresses and can include personally identifiable information. Before accessing or storing them, check your organization’s privacy and compliance requirements, particularly if you operate in regions covered by GDPR or similar regulations. Many companies anonymize IP addresses in stored log data for exactly this reason.

Key Metrics to Analyze in Log Files
Raw log files look like a wall of text. Each line represents a single request, and a busy site might have millions of lines per day. The goal isn’t to read every line. It’s to filter for the signals that matter.
Here’s what to focus on.
Googlebot Visits
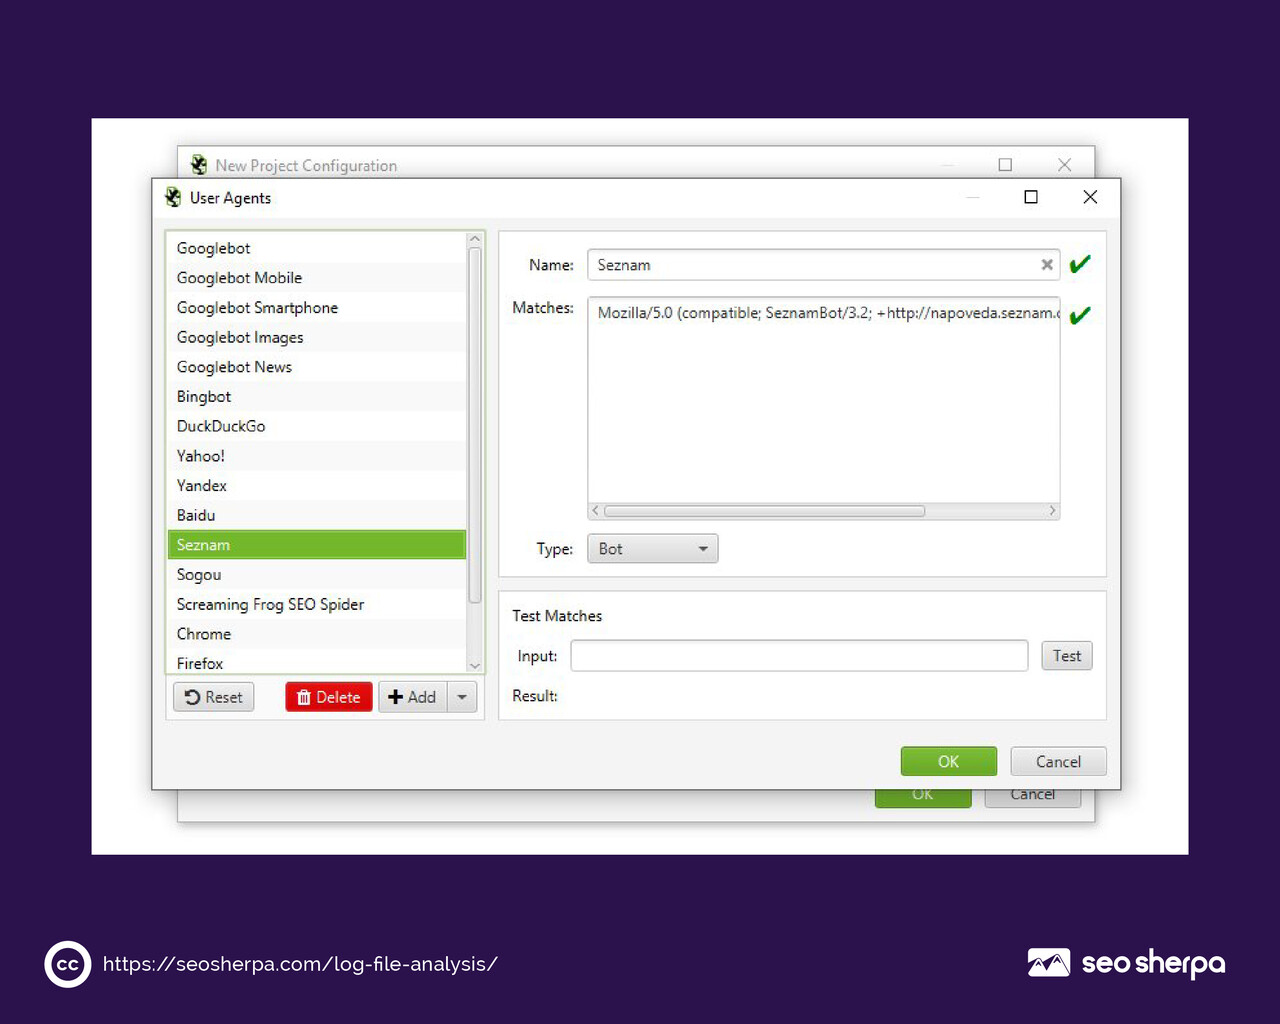
Filter your log data by user agent to isolate Googlebot requests. The user agents to look for include Googlebot (the main web crawler), Googlebot-Image (for images), and Googlebot-Video (for video content). You can also look for Bingbot, Applebot, and other search engine bots.
Once filtered, you have a precise record of which URLs Googlebot has visited, when it visited them, and what response code it received. That’s your crawl map.
Crawl Frequency
How often is Googlebot visiting your most important pages? How long since it last crawled your newest content?
Crawl frequency data from your log files tells you whether Googlebot is treating your priority pages as priority pages. If a key commercial page hasn’t been crawled in weeks, that’s a problem worth investigating — it might be caused by poor internal linking, a low crawl budget allocation, or a subtle technical issue blocking bot access.
HTTP Status Codes
Every request in your log file comes with a response code. This is where the diagnostic value of log analysis really shines.
A 200 means the page loaded successfully. A 301 means a permanent redirect was followed. A 404 means the requested page wasn’t found. A 500 or 503 means the server returned an error.
The patterns in those status codes tell a detailed story. A high volume of 404 requests from Googlebot means broken internal or external links that need to be addressed. Repeated 301 chains mean Googlebot is wasting crawl budget following redirect hops instead of going directly to the canonical URL. A spike in 503 responses during certain times might point to server capacity issues that are actively disrupting crawl activity.
Crawl Depth and Timestamps
How deep into your site architecture is Googlebot crawling? Are pages buried five or six levels deep being crawled at all?
Timestamps in your log files allow you to build a crawl depth picture over time. If pages beyond a certain depth are being ignored entirely, that’s a structural signal that your site architecture needs flattening or your internal link structure needs strengthening.
Tools for Log File Analysis
Let’s be honest: parsing log files manually for a site with any significant traffic volume is not a realistic workflow. You need tools.
The good news is that your options range from completely free to enterprise-grade, depending on what you need.
Manual vs. Automated Tools
Manual analysis using spreadsheet software like Google Sheets or Microsoft Excel is a legitimate starting point for smaller sites. You can import a filtered log file, sort by user agent, and pivot the data to identify crawl patterns. It’s time-consuming and doesn’t scale well, but it costs nothing and gives you full control over the analysis.
Command-line tools like grep and awk are powerful for parsing large log files on a Linux server. If you’re comfortable with the command line, a few well-crafted grep commands can filter Googlebot activity, isolate specific status codes, and count URL visit frequency faster than any GUI tool. This approach works well for developers and technically confident SEOs.
For most SEO practitioners, however, a dedicated log analysis tool is the smarter choice.
Pros and Cons of Popular Log Analysis Tools
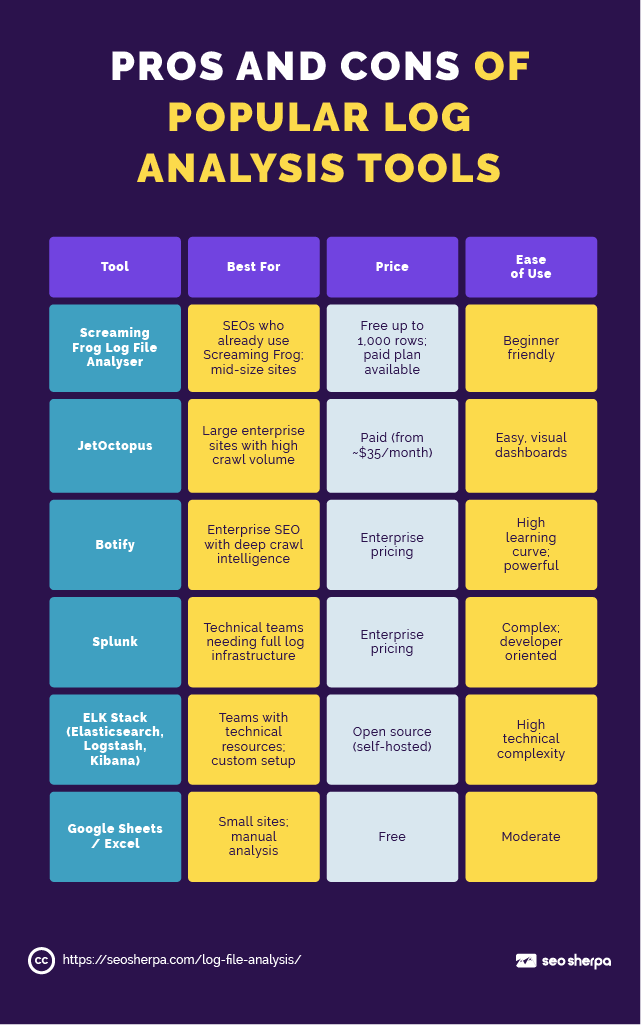
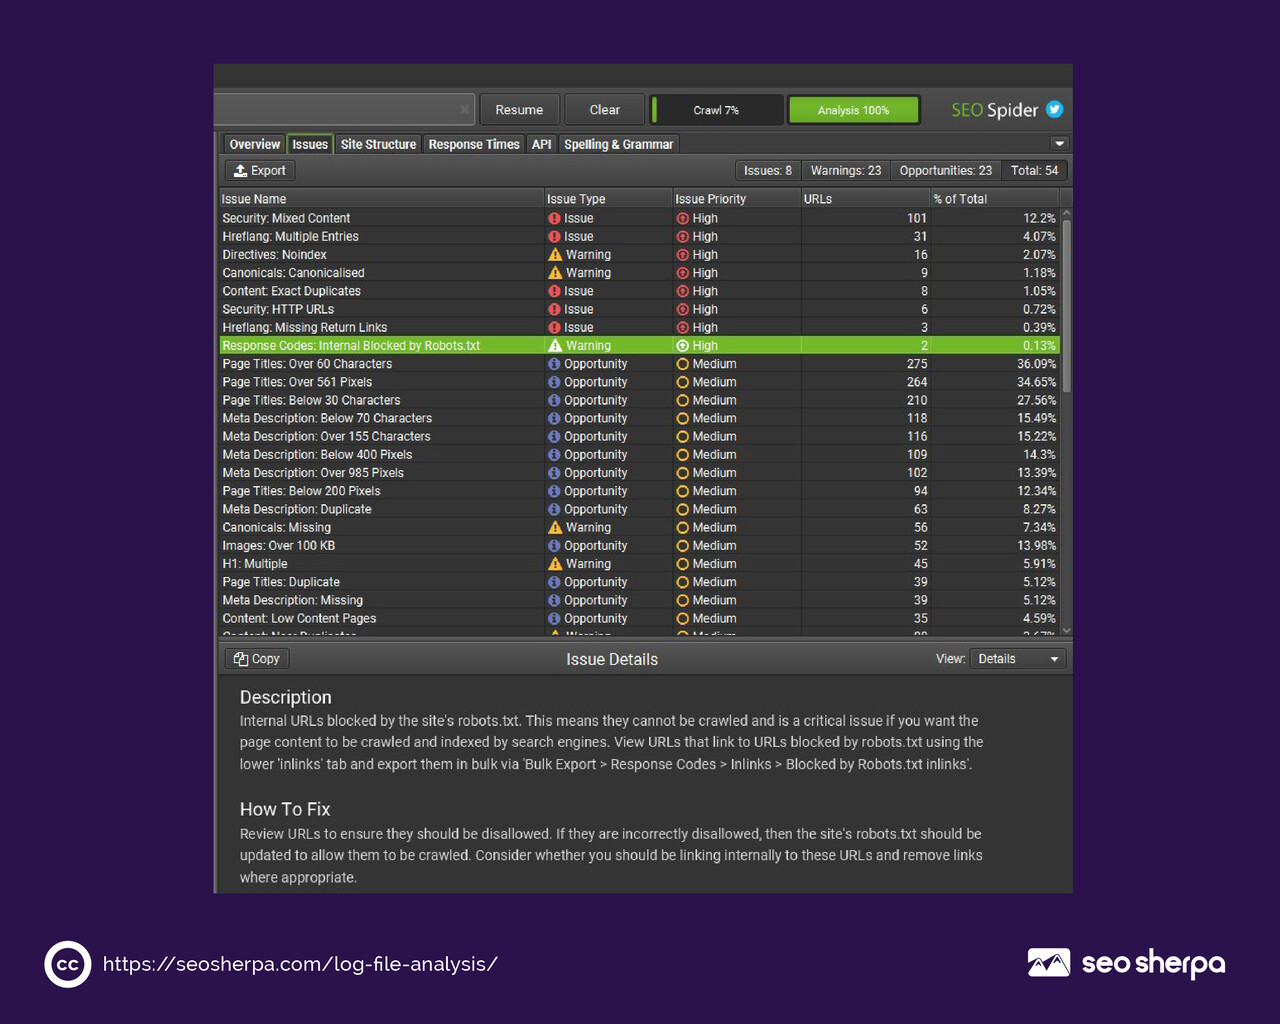
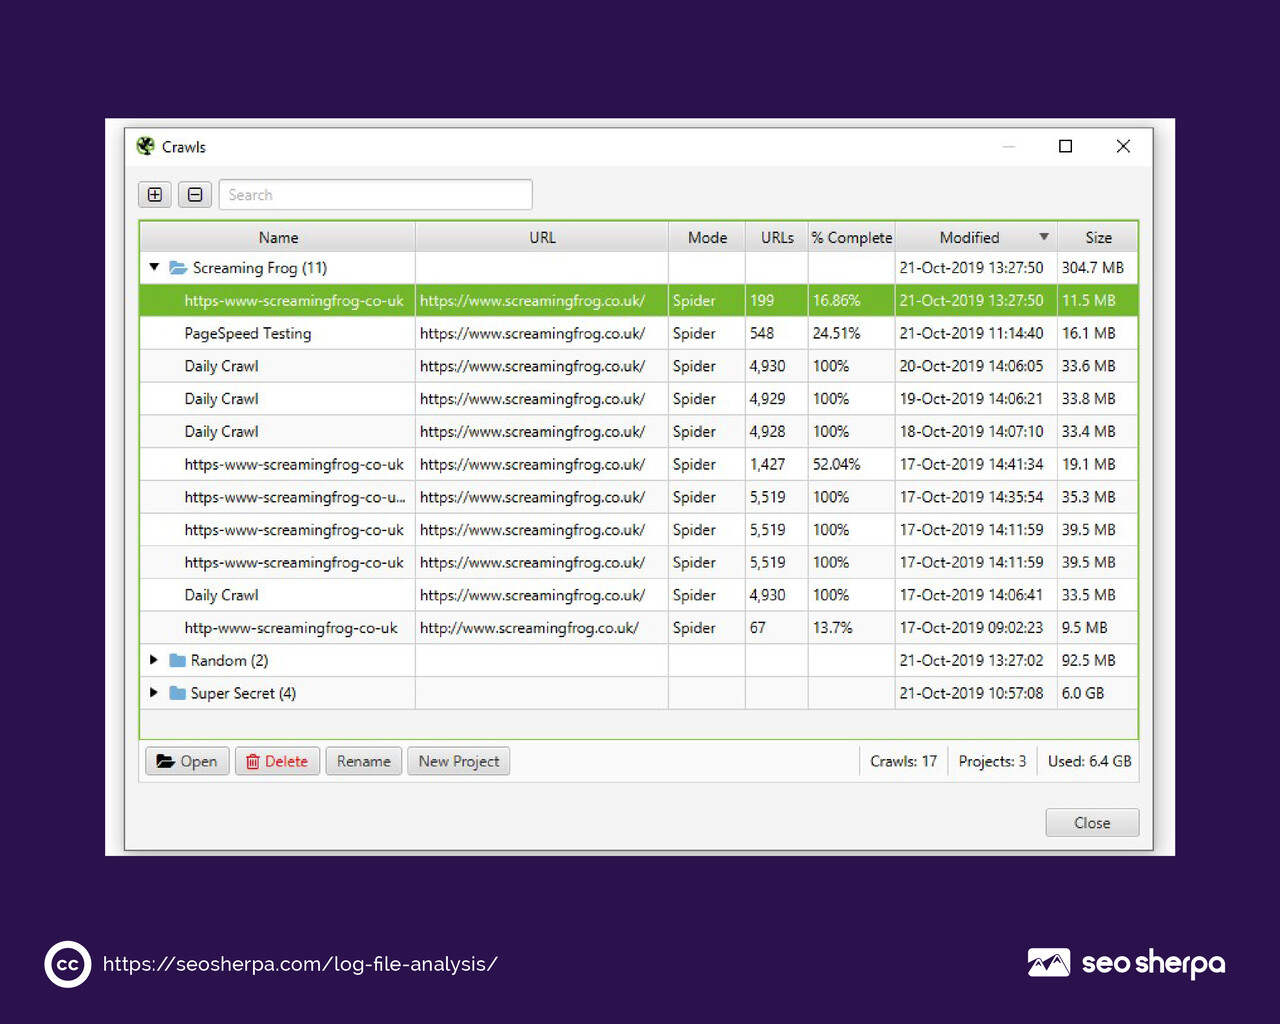
Screaming Frog Log File Analyser is typically the best starting point for SEOs who are new to log analysis. It’s designed specifically for the use case, handles common log formats, and surfaces the crawl insights you care about without requiring you to configure a full data pipeline.
JetOctopus is worth the investment for larger sites. It handles millions of log lines, presents crawl data visually, and allows you to cross-reference log data with your sitemap and crawl data in one interface.
The ELK Stack (Elasticsearch, Logstash, Kibana) is an open-source suite that provides a flexible and scalable solution for log analysis at volume. It’s extraordinarily powerful, but it requires technical setup and maintenance. Most SEOs working with ELK are doing so with developer support.
Step-by-Step Guide to Conducting Log File Analysis
Now for the practical part.
Here’s how to actually work through a log file analysis, from raw data to actionable insights.
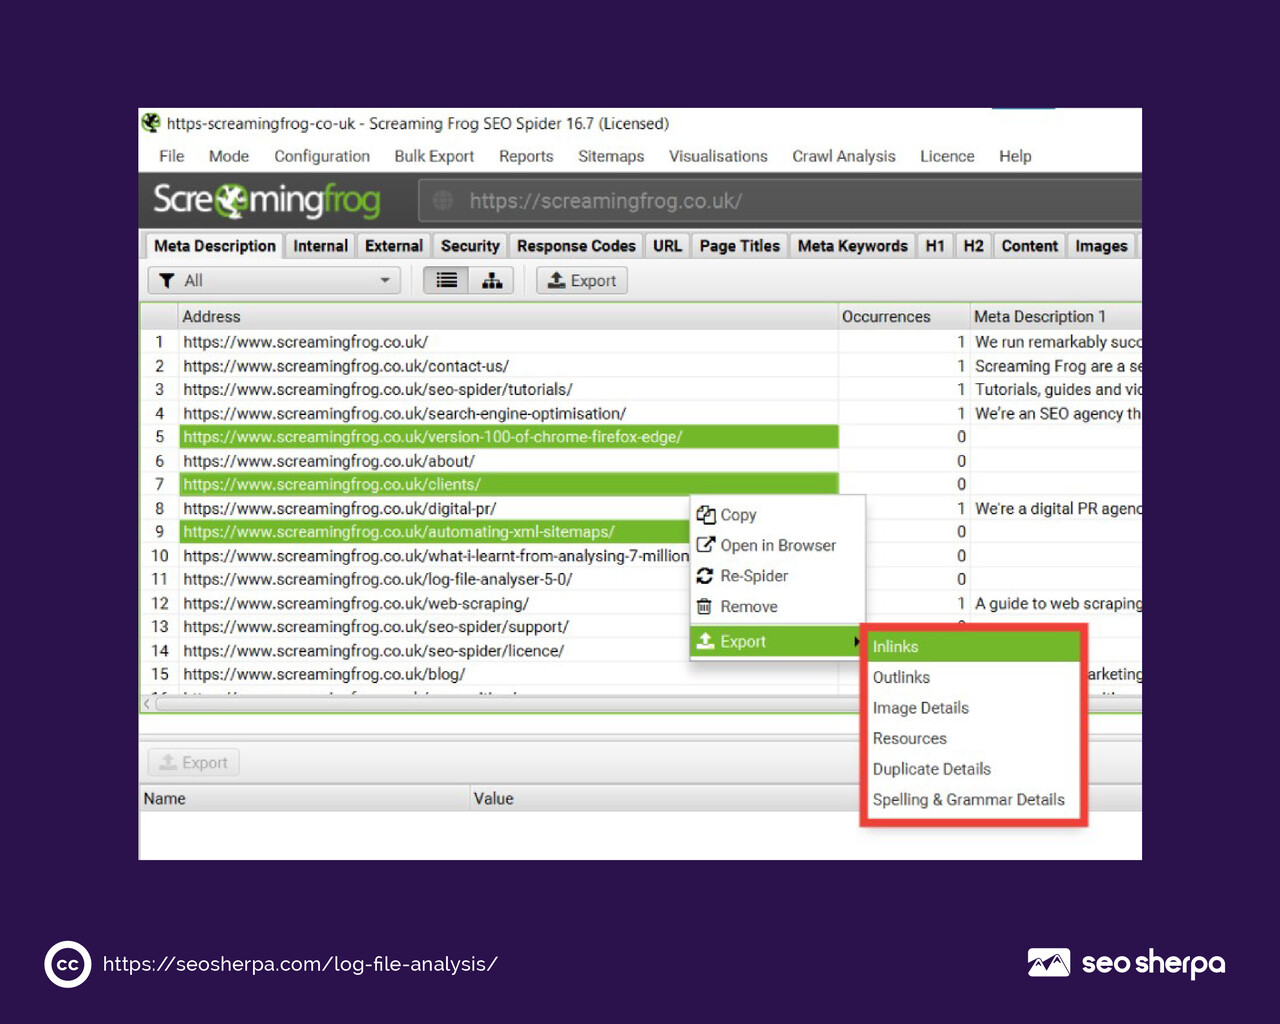
Step 1: Request and Export Your Log Files
Start by getting the files. If you manage your own server, locate your access logs in the directories mentioned above. If you’re working on a client’s site, request access logs from their development team. Be specific; you want access logs covering at least the last 30 days, ideally 90 days for trend analysis.
Log files can be large. A high-traffic site might generate multiple gigabytes of log data per day. If storage or download size is an issue, ask your developer to filter the logs for a specific time period before exporting.
Step 2: Filter by Bot and User Agent
Once you have your log data, the first filter to apply is user agent.
You want to isolate search engine bot activity from human traffic. For SEO purposes, the most important user agents to filter for are Googlebot and Bingbot. In a spreadsheet tool or your chosen log analysis tool, filter rows by user agent string to separate bot requests from everything else.
This step is non-negotiable. Mixing human and bot traffic in your analysis will muddy every insight that follows.
Step 3: Identify SEO Errors
With Googlebot traffic isolated, sort your log data by HTTP status code and look for patterns.
Start with 404 errors. Which URLs is Googlebot hitting that return a not-found response? Are these old URLs that should have been redirected? Are they being linked to internally from existing pages? Pull a list and cross-reference against your current site structure.
Then move to redirect chains. Are there URLs returning 301 that redirect to another URL that then redirects again? Googlebot follows redirect chains, but each hop costs crawl budget and dilutes signals. Flattening these chains to a single direct redirect is quick technical work with a meaningful impact.
Flag any URLs returning 500 or 503 errors, too. If server errors are appearing in your log data, Googlebot is encountering them — and repeated server errors on important pages can negatively affect crawl frequency over time.
Step 4: Track Crawl Frequency by URL Segment
Group your filtered log data by URL segment: product pages, blog posts, category pages, and so on. For each segment, calculate how often Googlebot visits pages and when it last visited.
This analysis often surfaces something counterintuitive.
The pages getting crawled most frequently are not always the pages you’d choose to prioritize. Faceted filters, session parameters, duplicate content paths — these can consume a disproportionate share of your crawl budget while your most important content sits relatively untouched.
Compare crawl frequency against actual page value (traffic, conversions, revenue) to identify where the imbalance lies.
Step 5: Visualize and Act on Your Insights
Raw numbers are useful. Patterns are actionable.
Once you’ve worked through your log data, build a summary view that maps your findings: which URL segments are over-crawled, which are under-crawled, where errors are concentrated, and which pages haven’t been visited in concerning timeframes.
Use this as your action prioritization list. Fix redirect chains first — they’re high-impact, low-effort. Address 404 errors next by implementing proper redirects or removing broken internal links. Then look at your robots.txt and noindex directives to reclaim crawl budget from low-value URL patterns.
Common Issues Found Through Log Files
Log file analysis consistently surfaces the same categories of problems. Here’s what to watch for.
Non-Indexable Pages Consuming Crawl Budget
This is one of the most common findings on larger sites. Pages with a noindex directive, pages that are canonicalized away, or pages explicitly blocked via robots.txt should not be receiving significant Googlebot attention. But they often are.
If Googlebot is regularly crawling pages it can’t and won’t index, that’s a crawl budget problem. The fix typically involves tightening your robots.txt rules, improving canonical implementation, or restructuring parameter handling.
Bot Traps and Crawl Loops
A bot trap is a section of your site that pulls crawlers into an infinite or near-infinite loop of page generation. Common causes include calendar-based pagination, filter parameter combinations, and infinite scroll implementations that generate unique URLs.
If you see thousands of Googlebot requests to a particular URL pattern with minor variations, that’s a bot trap. It needs to be identified in your URL structure and addressed at the server or CMS level before it consumes your entire crawl budget.
Missed Priority Pages
The flip side of over-crawling is under-crawling. Log file analysis often reveals important pages — product listings, category hubs, high-value blog content — that Googlebot is visiting infrequently or hasn’t visited at all recently.
This usually comes down to internal linking. If your site’s most important pages are buried deep in the architecture with few internal links pointing to them, Googlebot treats them as low priority. Strengthening internal links to those pages, adding them to your XML sitemap, and featuring them more prominently in site navigation are the standard remedies.
Best Practices and Tips
Getting value from log file analysis is about consistency as much as technique.
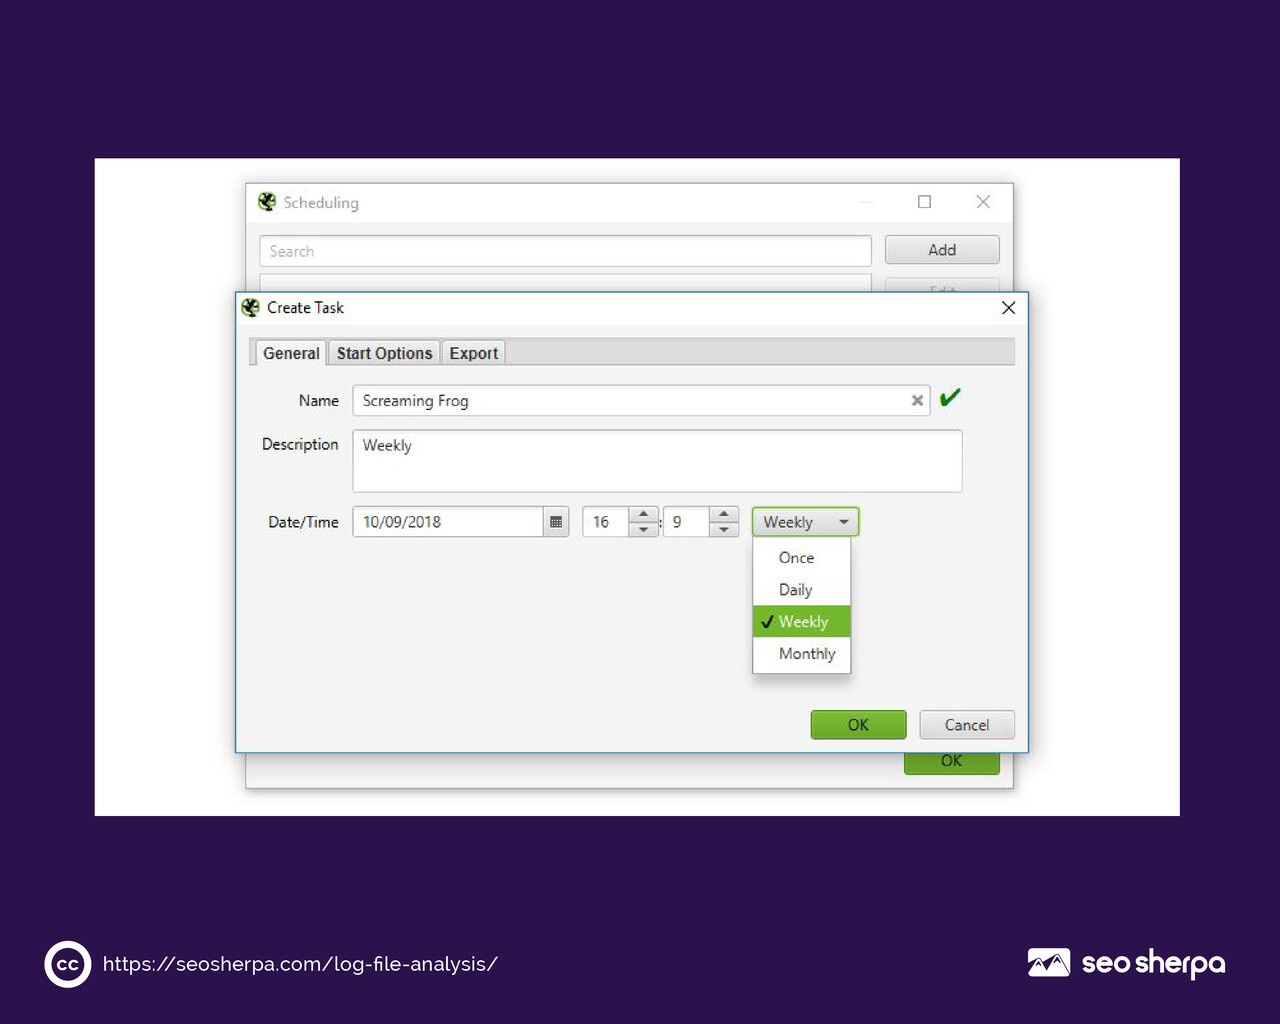
Set up regular analysis as a recurring workflow. Log file analysis is not a one-time audit task. Websites change constantly, and search engine crawlers adapt to those changes. A log file review every 30 to 90 days gives you a running picture of how crawl behavior evolves as you make changes to your site.
Combine log data with crawl data for the most complete picture. Running Screaming Frog or a similar crawler alongside your log file analysis allows you to cross-reference what you find crawled in the logs against what actually exists on the site. Pages that appear in log files but not in a crawl are your orphan pages. Pages that exist in a crawl but are absent from log files are being missed by Googlebot entirely.
Automate where possible. For high-traffic sites, manually exporting and analyzing log files every month is not sustainable. Tools like JetOctopus and Botify ingest log data continuously and surface alerts when crawl behavior changes significantly. Building that automation into your workflow shifts log analysis from a periodic project to a continuous monitoring capability.
What If I Can’t Access Log Files?
Not everyone has direct access to server logs, particularly those working on client sites where server access is restricted, or on platforms like Shopify where log files aren’t made available to users by default.
In those cases, Google Search Console’s Crawl Stats report is your closest alternative. It provides sampled crawl data, including crawl request volume by response code, crawl request trends over time, and file type breakdown. It’s not as detailed or complete as raw log file analysis, but it covers the most critical signals for most sites.
For clients who want deeper access, raising the question of log file access during technical onboarding is worthwhile. Many developers can set up log streaming to a shared location or provide periodic exports without much friction once the business value is understood.
How Often Should I Run Log File Analysis?
For most sites, a thorough log file review every 30 to 90 days is appropriate. For enterprise sites with large page counts, frequent content updates, or recent significant technical changes, monthly analysis is closer to the right cadence.
The trigger-based answer is also useful: run a log file analysis any time you notice an unexplained drop in crawl coverage in Search Console, after a major site migration, after a large-scale URL restructure, or after implementing significant changes to robots.txt or canonical directives. These are the moments when log data most quickly tells you whether your changes are having the intended effect on crawler behavior.
Wrapping Up: Make Log File Analysis a Core Part of Your SEO Strategy
If there’s one thing to take away from this guide, it’s this: log files show you the truth.
Not an estimate. Not a sample. The actual record of how Googlebot interacted with your site.
For beginners, the process can feel daunting at first. Raw log data is messy, the files can be enormous, and the technical setup required to access them varies widely across different server environments. But once you’ve worked through your first analysis, the value becomes immediately obvious.
Analyzing log files surfaces the crawl budget waste, the broken pathways, the missed priority pages, and the bot behavior anomalies that no other tool in your stack will show you. Combine that with your crawl data, your Search Console insights, and your internal linking structure, and you have one of the most complete technical SEO pictures available.
The brands that treat log file analysis as a core part of their technical SEO workflow aren’t doing something exotic. They’re doing something foundational, and most of their competitors aren’t.
That gap is yours to close.
If you’d like help integrating log file analysis into a full technical SEO strategy for your site, the SEO Sherpa team would love to take a look. Book a free discovery call, and let’s talk about what’s really going on under the hood.


Leave a Reply