
Summarize This Article With AI
 Try with ChatGPT
 Try with Claude
 Try with AI Mode
Ecommerce demand is still growing. But the way shoppers find products is becoming harder to track.
Google search results now compete with marketplaces, social platforms, AI-generated recommendations, and shopping assistants for the buyer’s attention. Adobe found that traffic from AI sources to U.S. retail websites increased 393% year over year during the first quarter of 2026. That’s rapid growth, even if AI referrals still account for a smaller share of visits than established channels such as search.
For ecommerce brands, this doesn’t make SEO less important. It just makes visibility a bit more complex. Your products must be easy for search engines to crawl, useful enough to rank, persuasive enough to convert, and structured clearly enough to surface across AI-driven product discovery.
This guide breaks down the ecommerce SEO statistics that matter in 2026, including organic traffic, conversion rates, revenue contribution, site speed, mobile performance, product content, reviews, structured data, and changing search behaviour.
More importantly, we’ll explain what the numbers mean for your store—and where your SEO investment is most likely to produce measurable growth.
Article Summary
- Organic search remains a major ecommerce channel, accounting for 23.56% of ecommerce website traffic in Similarweb’s 2025 benchmark.
- Non-branded organic search still delivers scale. Visibility Labs found it generated about 68 times more revenue than ChatGPT referrals across the ecommerce websites studied.
- Faster ecommerce pages can directly support revenue. Rakuten 24 reported a 33.13% conversion-rate increase after improving Core Web Vitals.
- Mobile drives a large share of ecommerce revenue, but desktop still converts better in retail benchmark data.
- Product content, reviews, images, videos, and UGC all influence whether shoppers trust a page enough to buy.
- AI Overviews are expanding into shopping searches, appearing on 14% of shopping queries in March 2026.
- Ecommerce SEO success in 2026 depends on more than rankings. Brands need technical strength, scalable content, structured data, trust signals, and visibility across Google, AI, marketplaces, and social platforms.
Why Ecommerce SEO Statistics Matter in 2026
Ecommerce is still expanding, but growth alone doesn’t guarantee that a single store will attract more traffic or increase revenue.
U.S. retail ecommerce sales reached an estimated $326.7 billion in the first quarter of 2026, up 2.7% from the previous quarter. That creates more opportunity—and more competition from retailers, marketplaces, and advertisers targeting the same product searches.
Product discovery is becoming less predictable, too.
Shoppers now move between Google results, Shopping listings, marketplaces, social platforms, and AI-generated recommendations before reaching a product page. Google has already added product comparison and shopping features to AI Mode, making the path to purchase less linear.
But that doesn’t mean organic search is disappearing.
BrightEdge’s analysis of website traffic from January through August 2025 found that AI search accounted for less than 1% of referral traffic, while organic search remained the largest source and produced substantially more conversions.
Paid acquisition is getting harder to rely on, too. LocaliQ’s 2026 search advertising benchmarks found that the average cost per click reached $5.42 across all industries.
Every paid visit has a direct cost. Organic visibility can continue attracting qualified shoppers without charging for each click, provided the rankings, content, and technical foundation are maintained.
That is why ecommerce SEO statistics matter. They help you assess whether:
- Organic traffic is healthy for a store of your size
- Product and category pages convert competitively
- Mobile performance or slow load times are suppressing revenue
- Your next investment should focus on technical SEO, content, UX, or authority
A 10% increase in traffic may look strong until you learn competitors are growing twice as fast. A 2% conversion rate may be weak in one category and healthy in another.
The important part is context.
The benchmarks in this guide will help you assess performance, identify gaps, and decide where optimisation is most likely to improve revenue. They also support a broader Search Everywhere Optimization strategy, where visibility is measured across Google, marketplaces, social platforms, and AI-assisted search rather than rankings alone.

Ecommerce Growth & Search Demand: How Big the Opportunity Is
Ecommerce is already a major part of the global economy, but the opportunity is still expanding.
UN Trade and Development (UNCTAD) reported that 2.3 billion people shopped online in 2021, up 68% from 2017. Across 43 economies representing roughly 75% of the world’s GDP, ecommerce sales reached almost $27 trillion in 2022.
These figures include business-to-business and business-to-consumer transactions, so they should not be read as online retail sales alone. But they show the scale of the digital buying economy.
The opportunity is also highly concentrated.
Similarweb found that the top 1% of sites captured 88% of traffic in its U.S. dataset. The largest ecommerce websites received around 900 times more traffic than emerging players.
This isn’t meant to discourage new players, of course. It shows why search visibility matters even more as AI changes how shoppers discover and compare products.
Smaller stores rarely have the direct traffic or brand recognition of Amazon, Walmart, or another established marketplace. That means they need to appear while shoppers are still researching products, comparing options, and deciding where to buy.
How Much of Ecommerce Traffic Comes From Organic Search?
Organic search accounted for 23.56% of ecommerce website traffic in Similarweb’s 2025 SEO Benchmark Report.
It was the second-largest channel after direct traffic at 57.66%, and delivered a much larger share than paid search at 6.88% or social traffic at 6.04%.
The figures cover the top 1,000 U.S. ecommerce websites from January through November 2024. They provide a useful benchmark, but traffic mix varies by category, brand maturity, and business model.
Established marketplaces often receive more direct and branded traffic. Newer direct-to-consumer brands tend to rely more heavily on non-branded searches, including:
- Product comparisons
- Buying guides
- Category searches
- Problem-led queries
Similarweb also found that branded and direct visits together made up 71.7% of ecommerce traffic, while only 3.5% of the audience visited a single ecommerce website. Shoppers frequently compare multiple retailers.
That creates an opening for brands that appear during the comparison stage.
Strong ecommerce SEO gives a store more opportunities to intercept that demand through category pages, product pages, buying guides, review content, and search features such as product results.
The opportunity is not evenly distributed, though. Contentsquare found that organic retail traffic fell 4% in 2025, while paid traffic accounted for 54% of visits in fashion and specialty retail.
Stores with established brands may lean heavily on direct demand. Newer brands often need SEO to build discovery before that demand exists.
Global Ecommerce Growth & Search Behaviour
Shopping behaviour is spreading across more search formats and stages of the purchase journey.
Google reports that people shop across its platforms more than 1 billion times per day. In a Google and Ipsos study covering 18 markets, 80% of surveyed Gen Z online shoppers said they used Google to discover, browse, research, get ideas for, or purchase products.
Searches are also becoming more specific and situational. Common ecommerce intent patterns include:
- Comparison intent: “best running shoes for flat feet”
- Problem-solving intent: “laptop for video editing under $1,000”
- Local intent: “furniture store near me”
- Value intent: “best budget noise-canceling headphones”
- Validation intent: “[product name] reviews”
These queries may attract less volume than broad product keywords, but they often reveal more about what the shopper needs and how close they are to buying.
Search behaviour is becoming more conversational, too. Google reported in 2026 that AI Mode searches beginning with “which” grew 40% faster than AI Mode queries overall during the previous six months.
That means ecommerce keyword research needs to cover more than product names and category terms. It should map the full decision process: discovery, comparison, validation, local availability, and purchase.
Brands need content for the full decision process: discovery, comparison, validation, local availability, and purchase. The opportunity is not simply to rank for more keywords but to appear at more of the moments that shape what a shopper buys.
Ecommerce Conversion Benchmarks: What SEO Traffic Produces
Traffic only creates value when it leads to a meaningful action.
For an ecommerce store, that usually means a completed purchase. But some reports also count add-to-cart actions, registrations, form submissions, or other events as conversions. That is why two credible benchmark studies can publish very different rates without either being wrong.
The safest approach is to compare like with like: the same conversion event, traffic source, device, product category, and attribution model.
Organic Conversion Rate Benchmarks
There is no universal organic conversion rate for ecommerce.
Visibility Labs analysed 9.46 million non-branded organic sessions across 94 seven- and eight-figure ecommerce brands and found that non-branded organic traffic converted at 1.39% in 2025.
The study excluded homepage and blog visits, focusing on commercial-intent sessions. That distinction matters.
Branded organic searches typically come from shoppers who already know the retailer or product. Non-branded searches bring in people who may still be deciding what to buy, which brand to trust, or whether they need the product at all.
As a result, a store with a high proportion of branded search traffic may report a stronger overall organic conversion rate than a newer brand that relies heavily on discovery and comparison queries.
Sitewide benchmarks provide context but should not be treated as organic-only data. Shopify reports that average ecommerce conversion rates typically fall between 2% and 3%, although results vary by industry, intent, and conversion definition.
These figures reflect overall ecommerce performance rather than organic-search-only traffic and can vary significantly depending on factors such as industry, customer intent, and how conversions are defined.
Device and visitor type also affect performance:
- Desktop conversion rates were 74% higher than mobile rates
- Mobile still generated 69.9% of website traffic
- Returning visitors converted at 2.9%, compared with 1.7% for new visitors
A blended organic conversion rate can therefore hide mobile friction, differences in search intent, and purchases completed through another channel or device.
A category page may introduce a shopper to the brand through a non-branded search. The eventual purchase may happen days later through branded search, direct traffic, email, or another device. Under a last-click attribution model, the original organic discovery visit may receive none of the credit.
This is why you should segment organic conversion performance by:
- Branded and non-branded search
- New and returning visitors
- Mobile and desktop
- Product and category
- Landing-page type
- New-customer and repeat-customer revenue
- Assisted and last-click conversions
A 1.5% rate from non-branded category traffic may be healthy. The same rate from branded product searches could indicate problems with pricing, availability, trust, or checkout usability.
The number alone tells you very little. The intent behind the visit tells you what to improve.
Revenue Contribution From SEO
There is no reliable industry-wide percentage showing exactly how much ecommerce revenue comes from SEO.
Public reports often combine organic search with direct traffic, email, branded paid search, social referrals, and other unpaid channels. Attribution systems also tend to award revenue to the final visit, even when organic search introduced the shopper earlier in the journey.
Still, public company filings show that unpaid discovery can support a substantial share of ecommerce sales.
Etsy disclosed that performance marketing generated 21% of its gross merchandise sales (GMS) in 2024. That left 79% of GMS not attributed to performance marketing, supported by brand awareness and channels such as search, social media, email, and push notifications.
That is not the same as saying organic search generated 79% of Etsy’s GMS.
But it does show what is possible when a marketplace has strong brand recognition, extensive indexable inventory, repeat customers, and multiple unpaid discovery channels working together.
REVOLVE provides a different example. In its fiscal 2023 filing, the retailer said 49% of traffic came from free and low-cost sources. That bundle included direct visits, email links, branded paid search, and organic search rather than SEO alone.
The takeaway is not that every ecommerce brand should aim for 49% or 79%.
It is that the revenue contribution from organic search depends heavily on the business model.
A mature marketplace may generate substantial branded and unpaid demand. A direct-to-consumer retailer that grew through paid social may receive a much smaller share of revenue from SEO. An Amazon-native brand may have little owned-site organic revenue because shoppers purchase through the marketplace instead.
A newer analysis illustrates the scale difference between emerging and established channels.
Visibility Labs found that ChatGPT referrals generated $474,000 in revenue across the 94 ecommerce websites it studied in 2025. Non-branded organic search generated $32.1 million—about 68 times more revenue.
ChatGPT traffic converted at a higher rate and delivered slightly more revenue per session. But non-branded organic search produced vastly more sessions and total revenue.
This is an important distinction:
Conversion efficiency does not equal revenue scale.
A small source can convert well without contributing much to the business. A larger channel can convert at a lower rate and still produce far more sales.
Branded and non-branded keywords play different roles here as well.
- Branded organic search usually captures existing demand from shoppers already familiar with the store
- Non-branded organic search helps create and intercept new demand through category, product, comparison, and problem-solving queries
- Informational content may assist revenue without receiving last-click credit
- Product and category pages tend to sit closer to the transaction and are easier to connect directly to sales
The bottom line? Ecommerce SEO reporting should go beyond traffic and rankings.
Track organic revenue, revenue per session, new-customer revenue, assisted conversions, average order value, and gross margin by landing-page group. Then compare branded and non-branded performance separately.
This connects ecommerce SEO to the metric that matters most: profitable revenue, not traffic for traffic’s sake.
Technical SEO Statistics That Influence Ecommerce Performance
Technical performance affects whether shoppers stay long enough to buy and whether search engines can access the pages that generate revenue. It is not usually the most exciting part of ecommerce SEO, but it is often where some of the biggest gains come from.
A store can have great products, strong content, and solid rankings, yet still lose sales if pages load slowly, key resources fail to render properly, or search engines struggle to crawl important sections of the site.
Site Speed, Core Web Vitals & Load Time Benchmarks
Faster ecommerce websites tend to convert better.
After improving its Core Web Vitals, Japanese ecommerce retailer Rakuten 24 reported a 33.13% increase in conversion rate and a 53.37% increase in revenue per visitor. Exit rates also fell by 35.12%, meaning fewer shoppers left before completing their journey.
These are results from one retailer rather than an industry-wide guarantee. But they show how faster, more stable pages can reduce abandonment and remove friction from the purchase process.
Core Web Vitals performance remains mixed across the web.
HTTP Archive’s 2025 Web Almanac found that 48% of mobile websites and 56% of desktop websites passed all three metrics. Among ecommerce platforms, performance varied considerably:
- Shopify: 76% passed on desktop and mobile
- WooCommerce: 33% on desktop and 35% on mobile
- Magento: 36% on desktop and 35% on mobile
The platform alone does not determine performance. Themes, apps, images, scripts, hosting, and custom code all affect page speed.
Still, the benchmarks show that many stores have room to improve. For ecommerce teams, the priority is to test the pages that carry the most commercial weight:
- Category and product pages
- Search results and filtered listings
- Cart and checkout pages
- High-traffic mobile landing pages
- Pages using heavy review, recommendation, or personalization tools
Page speed and page load time should be reviewed on the templates that carry commercial weight, not only on the homepage.
Mobile Ecommerce SEO Statistics
Mobile now carries a large share of both ecommerce traffic and revenue.
Adobe Analytics found that mobile accounted for 56.4% of U.S. online retail revenue during the 2025 holiday season. Yet mobile visits still converted less efficiently in Contentsquare’s retail data: average conversion rates were 3.7% on desktop and 2% on mobile.
But mobile traffic does not always convert as efficiently.
Contentsquare reported that desktop conversion rates were 74% higher than mobile rates. This gap suggests many shoppers are still encountering friction when browsing products, choosing variants, or completing checkout on smaller screens.
Mobile performance also affects search visibility. Google uses the mobile version of a page for indexing and ranking, so missing content, internal links, metadata, or structured data on mobile can limit how well the page performs in search.
For ecommerce teams, mobile optimization should focus on the actions that lead directly to revenue:
- Loading the main product image and content quickly
- Making filters and variant selectors easy to use
- Preventing buttons and page elements from shifting
- Simplifying forms and checkout steps
- Keeping the same important content and links available across mobile and desktop
Mobile optimization is not just responsive design. It is speed, layout stability, product visibility, and checkout usability on the device where many shoppers start.
Indexation, Crawling & Large-Site SEO Challenges
Ecommerce websites can generate far more URLs than products.
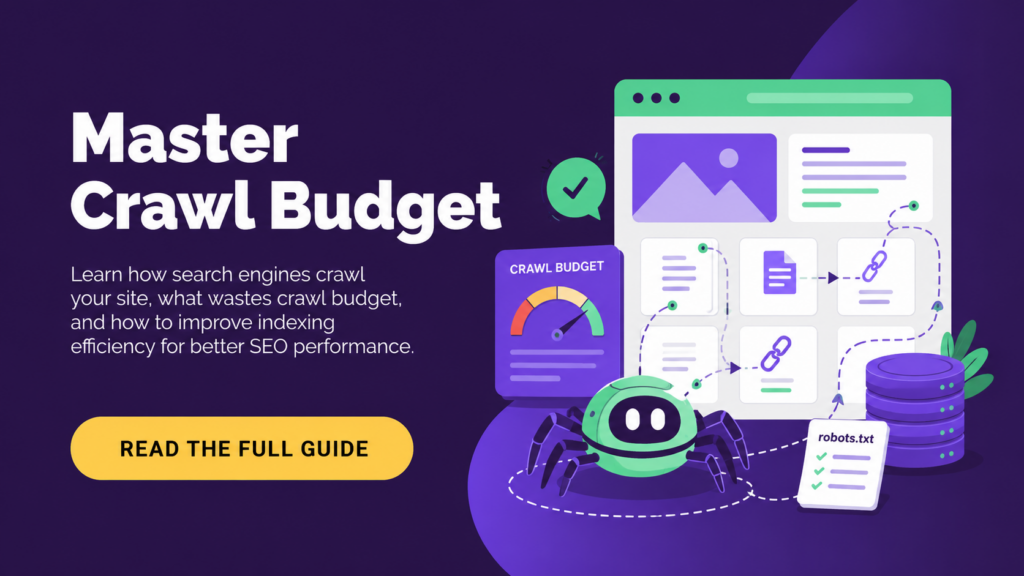
The biggest source of crawl waste on many large ecommerce stores is faceted navigation. Filters for size, colour, brand, price, availability, and sorting can create thousands of URL combinations from a single category page. This can produce a virtually infinite number of URLs, consuming crawling resources that could otherwise be used to discover important product and category pages.
When poorly controlled, other potential sources of crawl waste are:
- Product variants that create near-duplicate URLs
- Tracking and session parameters
- Indexable internal search pages
- Duplicate filter, sorting, and pagination paths
- Expired product pages with no remaining search or user value
The scale of the problem depends on the store’s platform, catalogue, navigation, and URL rules. Canonical tags and canonical URLs help consolidate duplicate or near-duplicate pages when filters, variants, or parameters create multiple paths to similar content.
Thin content can make the problem worse. Product pages that repeat manufacturer descriptions and category pages with little useful information give search engines fewer reasons to prioritize them over competing results.
The goal is not to index every possible URL, but to help search engines reach the pages that are unique, useful, and commercially important. Compare the URLs in your product catalogue, XML sitemaps, Google’s index, and organic landing-page reports to identify valuable pages being missed—and low-value URLs consuming crawling resources.
Search Behaviour: How Shoppers Discover Products
Product discovery no longer begins in one place. Shoppers move between search engines, marketplaces, social platforms, and brand websites as they research, compare, and validate purchases.
Product Search Entry Points
1. Search Engines
- 23.2% of surveyed U.S. consumers started their online shopping journey with a search engine such as Google or Bing, according to Hostinger’s 2024 survey.
2. Retailer Websites and Apps
- 56% of consumers started their product searches on Amazon, according to Jungle Scout’s Q1 2024 Consumer Trends Report. Search engines ranked second at 42%.
- 48.8% of surveyed U.S. consumers began their online shopping journey on a general retailer website or app, such as Amazon or Walmart.
3. TikTok
- 83% of shoppers surveyed by GlobalData and TikTok Shop said they had discovered a new product on TikTok Shop, while 70% had discovered a new brand.
- TikTok reported that its platform was 1.7 times more likely than other platforms to be a source of product discovery.
4. Pinterest
- 39% of consumers have used Pinterest as a search engine, according to Pinterest’s 2025 reporting.
These studies use different samples and definitions, so the percentages should be treated as platform-specific indicators rather than parts of a single market-share total.
Ecommerce Keyword & Intent Trends
- “Best” searches are becoming more specific. Google previously recorded 60% year-over-year global growth in mobile searches containing “best affordable,” showing how shoppers combine quality, use case, and price in a single query.
- Conversational comparison searches are growing. Google reported in 2026 that AI Mode queries beginning with “which” grew 40% faster than AI Mode searches overall during the previous six months.
- Branded and non-branded searches serve different roles. Similarweb found that branded and direct visits accounted for 71.7% of ecommerce traffic in its U.S. benchmark. Branded searches capture existing demand, while non-branded category, comparison, and problem-led queries help stores reach shoppers who have not chosen a retailer.
- There is no universal growth rate comparing branded with non-branded shopping queries. The balance varies by brand maturity, product category, campaign activity, and season.
- Seasonal demand often starts earlier than the sales event itself. Google found that worldwide interest in “school supplies” began accelerating in May 2025—one month earlier than the previous year.
- Evergreen demand continues between seasonal peaks. Product comparisons, reviews, compatibility questions, price searches, and local-intent queries can attract shoppers throughout the year.
Content & On-Page Ecommerce SEO Statistics
Strong ecommerce content helps shoppers evaluate products while giving search engines clearer signals about what each page should rank for.
Product Detail Page (PDP) Content Benchmarks
Product Titles and Descriptions
- 77% of shoppers rated product titles and descriptions as very or extremely important when deciding whether to complete a purchase, according to Salsify’s 2025 consumer research.
- 68% of shoppers consider written brand or retailer descriptions when viewing product pages, according to PowerReviews.
Images and Videos
- 61% of shoppers ranked product images and videos as the most important product-page element for completing a purchase in Salsify’s 2026 research.
- 73% of shoppers consider photos and videos from real customers when making purchase decisions, according to a PowerReviews survey of more than 8,000 U.S. consumers.
- 85% of shoppers said they were more likely to buy a product when user-generated photos or videos accompanied written reviews.
- 84% of shoppers want user-generated photos and videos displayed directly on product pages, while 54% also want them on category or search pages.
An older Salsify survey found that 66% of shoppers wanted to see at least three product images, but this is better treated as a minimum shopper-expectation benchmark than an SEO ranking factor.
The bottom line is to give shoppers enough original imagery to assess the product clearly, including multiple angles, scale, details, and real-world use where relevant.
Category Page (PLP) Performance Benchmarks
Product listing pages (PLPs) often target broader, higher-volume commercial queries than individual product pages.
A category page can rank for searches such as “women’s running shoes,” while each product page usually targets a narrower model, color, or specification. PLPs also remain useful when individual products sell out or change, making them more stable organic landing pages.
There is no reliable universal statistic showing that PLPs receive a fixed percentage more traffic than PDPs. The difference depends on catalog size, brand demand, keyword mix, and site architecture.
What we do know is that internal linking directly affects discovery:
- Google states that link architecture plays a critical role in helping Googlebot find pages
- Important category pages should be reachable through crawlable navigation links
- Product pages linked only through internal search, filters, or JavaScript interactions may be harder to discover
Faceted navigation can support shoppers while creating SEO problems if every filter generates a crawlable URL. Google warns that poorly controlled filters can create a near-infinite URL space, split indexing signals across duplicate pages, and delay the crawling of useful content.
The goal is to use filters for user experience without allowing every size, color, price, and sorting combination to compete for indexing.
Blog Content Supporting Ecommerce SEO
There is no reliable current percentage showing how many ecommerce brands use blogs specifically for search visibility.
There is also no universal blog-to-product conversion rate. Analytics platforms often credit the final product, email, paid, or direct visit even when a blog post introduced the shopper earlier.
That does not mean blog content has no commercial value.
- One ecommerce case study reported that a company blog generated approximately 35% of inbound ecommerce orders
- Another brand case study recorded a 47% year-over-year increase in blog sessions alongside a 548% increase in revenue, although the results cannot be attributed to blogging alone
- Educational content can rank for research-stage queries that product pages are poorly suited to answer, including comparisons, sizing, compatibility, care, and buying advice
Evergreen articles can continue attracting qualified visitors between seasonal campaigns. Their strongest commercial role is often assisted rather than last-click conversion.
To measure that contribution, track:
- Blog-assisted conversions
- Product-page clicks from blog content
- New-customer revenue
- Email sign-ups
- Return visits
- Revenue from users who first entered through educational content
The best ecommerce blogs do not operate as separate publishing channels. They connect research-stage questions to relevant categories and products through clear internal links and useful next steps.
Schema, SERP Features & Ecommerce Visibility
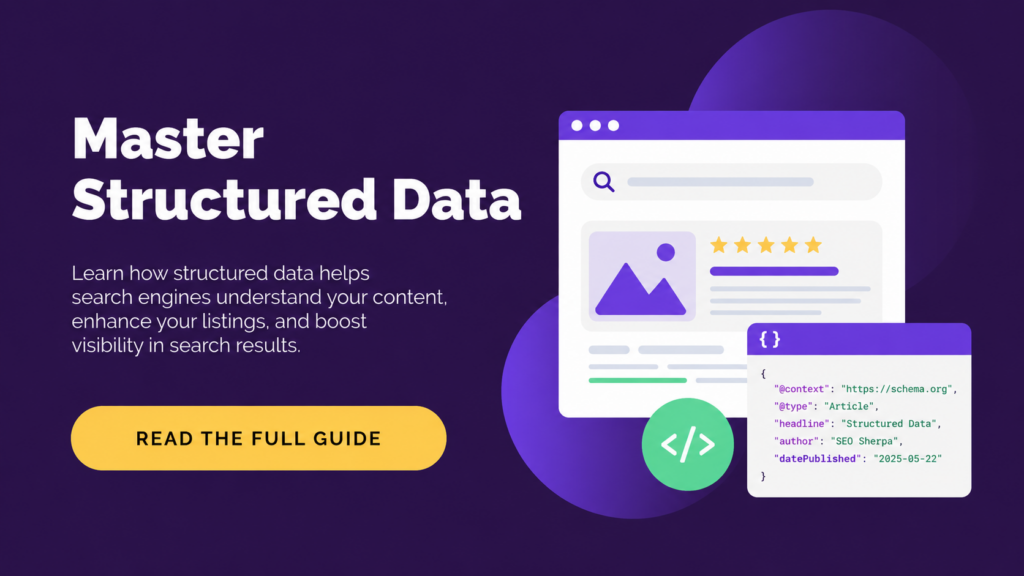
Structured data does not directly improve rankings. It helps Google understand product information and makes pages eligible for richer search appearances, including prices, availability, ratings, shipping details, and return information.
Structured Data Adoption Rates
Product structured data remains less common across the wider web than its value might suggest.
HTTP Archive’s 2024 Web Almanac found that:
- 53% of mobile inner pages and 51% of desktop inner pages contained some form of structured data
- Product schema appeared on 0.77% of all pages analysed
The 0.77% figure should not be read as the percentage of ecommerce stores using Product schema. HTTP Archive measures pages across the web, and Product markup usually appears on product pages rather than homepages.
Google does not publish a universal rate showing how often valid Product schema earns a rich result. Eligibility does not guarantee appearance because results vary by query, device, location, data quality, and Google’s systems.
However, valid Product schema markup can make listings eligible to show:
- Price and availability
- Review ratings
- Shipping information
- Returns details
- Product variants
- Merchant listings and product annotations
These additions can make a result more useful and noticeable, but there is no reliable ecommerce-wide CTR uplift for review, price, or availability markup.
Google’s broader structured-data case studies show the potential:
- Rotten Tomatoes recorded a 25% higher click-through rate (CTR) on pages enhanced with structured data
- Nestlé found that pages appearing as rich results had an 82% higher CTR than pages appearing as standard results
- Rakuten reported a 3.6 times higher interaction rate on Accelerated Mobile Pages with search features than on comparable pages without them
These are company-specific results rather than ecommerce benchmarks. The safest approach is to measure rich-result impressions and CTR in Google Search Console for your own product pages.
CTR Benchmarks for Ecommerce SERPs
Ranking position still has a major effect on organic CTR.
Backlinko’s analysis of 4 million Google results found that:
- The first organic result received an average CTR of 27.6%
- Position one was 10 times more likely to receive a click than position 10
- CTR differed very little among positions eight through 10
These are broad organic-search benchmarks. Shopping ads, product grids, local results, review stars, and other SERP features designed for ecommerce can change the CTR available to a conventional organic listing.
Rich results can improve visibility, but their impact is not uniform. Review stars, prices, and availability may help a product result stand out, while answer-focused features can sometimes satisfy the search without generating a click.
AI Overviews add another layer of competition.
A Seer Interactive study found that organic CTR for queries displaying AI Overviews fell from 1.76% to 0.61% between June 2024 and September 2025—a decline of about 65%. Brands cited within an AI Overview received 35% more organic clicks than those that were not cited.
A Visibility Labs analysis of 20.9 million shopping-related search results found that AI Overviews appeared on 14% of shopping queries in March 2026, up from 2.1% in November 2025—a 5.6-fold increase in four months.
The study focused on product-intent keywords that triggered paid or organic Shopping results, including terms such as “weighted blanket,” “mushroom coffee,” and “protein powder.”
There is not yet a reliable ecommerce-wide CTR benchmark showing exactly how much this reduces organic clicks. But the rapid growth of AI Overviews on shopping queries means product listings now compete with AI-generated summaries before shoppers reach standard organic or Shopping results.
User Experience & Trust Signals: Critical Ecommerce SEO Metrics
Traffic and rankings do not guarantee sales. Shoppers still need enough trust, clarity, and confidence to complete the purchase.
Reviews, Ratings & Social Proof
Reviews are now a core part of ecommerce decision-making.
- 98% of shoppers say reviews are an essential purchase resource, according to PowerReviews.
- 91% read reviews regularly or always, while 45% will not purchase a product if no reviews are available.
- Adding one review to a product page that previously had none can lift conversion by 52.2%. More than 10 reviews can increase conversion by 102.9%, according to PowerReviews.
- Products with five reviews are 270% more likely to be purchased than products with no reviews, according to research from the Spiegel Research Centre at Northwestern University.
The ideal rating is not necessarily a perfect five stars.
PowerReviews and Northwestern University Centre found that purchase likelihood peaked when products had an average rating between 4.2 and 4.5 stars. Nearly half of shoppers in a later PowerReviews survey said they were suspicious of products with a perfect five-star average.
The reason is simple: a small number of balanced, credible negative reviews can make the overall feedback appear more authentic.
For ecommerce teams, the priority is not only review volume. Review recency, detail, verified-purchase labels, photos, videos, and responses to negative feedback all influence trust.
Review collection should be treated as an SEO and conversion process, not just a post-purchase email. Fresh, detailed reviews give shoppers more proof and give product pages more useful content.
Cart Abandonment Statistics
Cart abandonment remains one of ecommerce’s biggest conversion losses.
Baymard Institute’s meta-analysis of 50 studies puts the average cart abandonment rate at 70.22%. In practical terms, roughly seven out of 10 shoppers who add an item to their cart leave without completing the purchase.
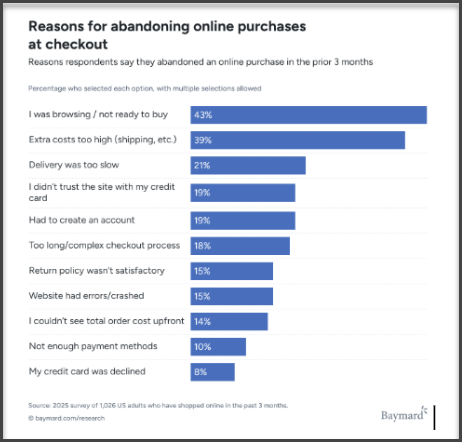
Some abandonment is unavoidable because shoppers are still comparing options or are not ready to buy. Among shoppers who abandoned for fixable checkout reasons, Baymard found the most common causes:
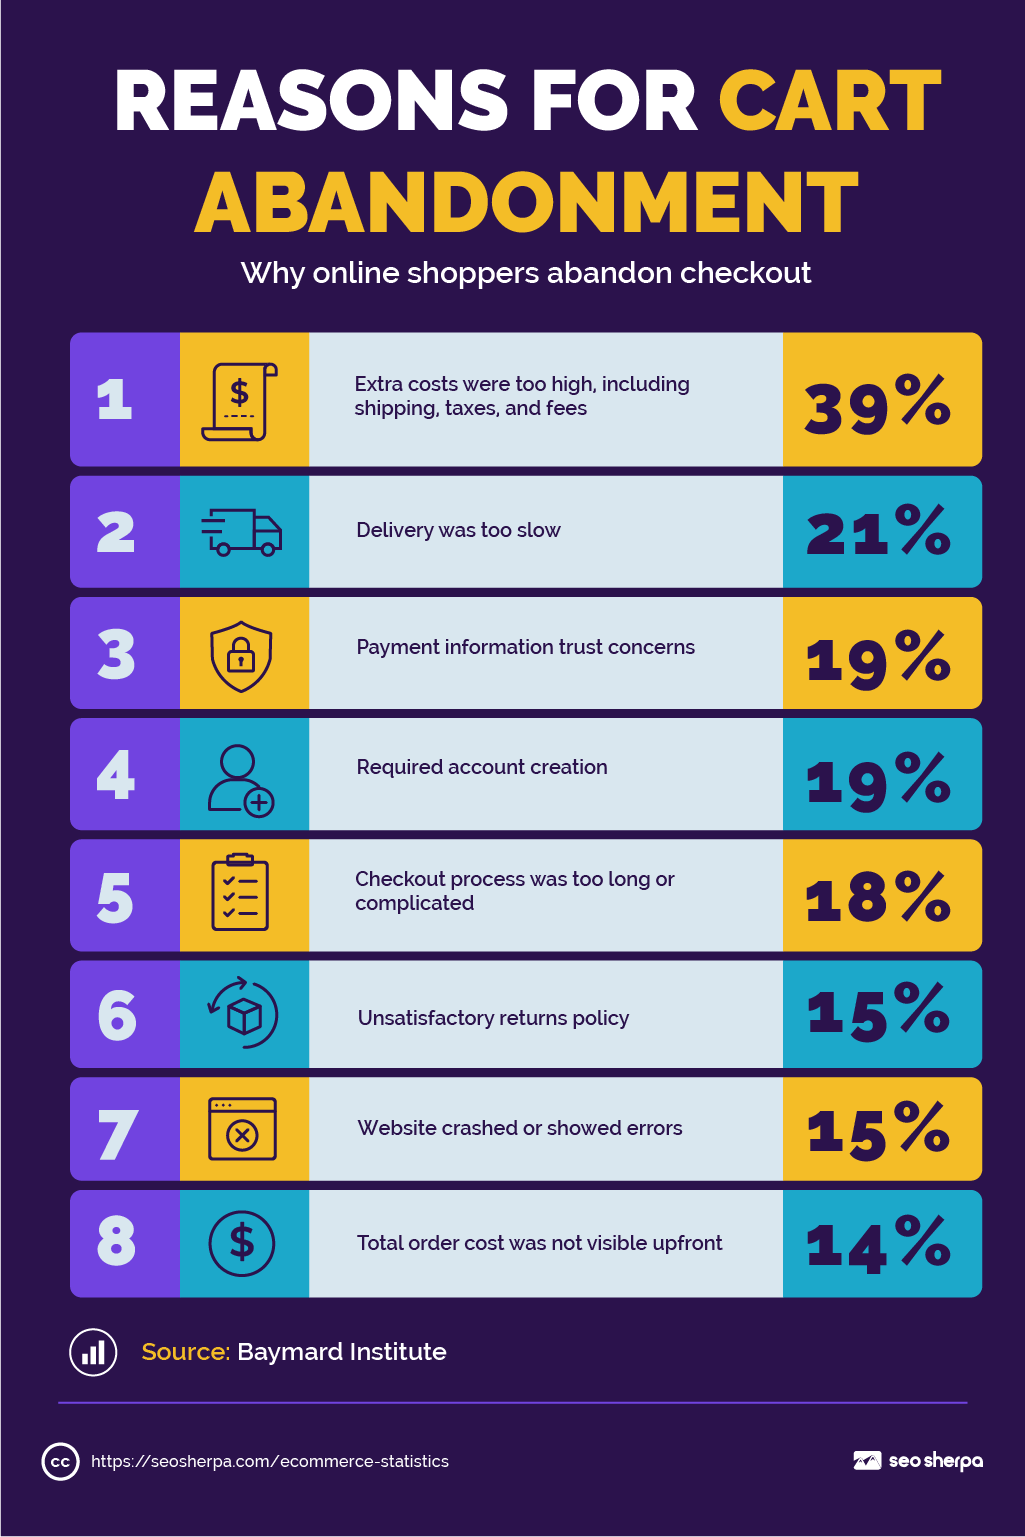
These figures show that abandonment is often a user-experience and trust problem rather than a traffic problem.
There is no reliable universal benchmark comparing cart abandonment rates from organic, paid, and social traffic. Channel intent varies too much, and most public reports measure conversion rates rather than cart abandonment after items have been added.
A shopper arriving through non-branded organic search may still be comparing products. Paid-search visitors may have stronger purchase intent but greater price sensitivity. Social visitors may be earlier in the journey.
The practical approach is to segment abandonment in your own analytics by:
- Traffic source and campaign
- New and returning visitors
- Mobile and desktop
- Product category
- Cart value
- Checkout stage
This helps separate traffic-quality problems from checkout friction. A channel may generate plenty of cart additions but still lose sales because of shipping costs, payment options, delivery speed, or mobile usability.
Ecommerce SEO Challenges. What Brands Are Struggling With
Most ecommerce brands aren’t struggling with SEO strategy. They’re struggling with scale.
Ecommerce SEO becomes harder as catalogs grow, search results become more crowded, and AI changes how shoppers compare products.
Technical Complexity
A site with 50,000 SKUs doesn’t have 50,000 SEO problems. It usually has a handful of structural problems, repeated 50,000 times.
Large stores can generate thousands of duplicate or low-value URLs from filters, sort options, tracking parameters, and product variants.
Google identifies faceted navigation and session identifiers as major crawl-budget problems because they can create large numbers of URLs with little additional value. Duplicate content, soft errors, and low-quality pages can waste further crawling resources.
Common technical challenges include:
- Multiple URLs for the same product or category
- Filter and sorting parameters creating near-duplicate pages
- Session and tracking parameters
- Variant URLs competing for the same query
- Important pages buried deep in the site architecture
- Discontinued or empty pages remaining crawlable
The larger the catalog, the more important it becomes to control indexable URLs, consolidate duplicates, and help Google prioritize commercially valuable pages.
Then there’s the slow leak of broken links, redirect chains, and metadata issues that build up as catalogues change.
JavaScript SEO can create another layer of complexity when product grids, filters, reviews, or internal links depend on scripts that are difficult to crawl or render consistently.
Meta descriptions get duplicated across thousands of PDPs because nobody templates them with unique variables. None of this shows up in a quarterly review. It shows up in a routine SEO audit, usually after rankings have already slipped.
Tools like Google Lighthouse and Google Search Console catch a lot of it. Running a bulk canonical or schema check across your full URL list, something tools like this can do, catches the rest.
Content at Scale
Writing one strong product description is easy. Writing 10,000 of them, each unique and each useful, is an operational problem.
The challenge is not just content quality. It is content velocity: how quickly a brand can publish, update, and improve useful product and category content across the catalog.
Most stores solve this content production dilemma by reusing manufacturer copy. Google’s John Mueller has said this doesn’t trigger an automatic duplicate content penalty, as reported by Search Engine Journal: a page only gets demoted for duplication when the entire page, not just the description, matches another site.
But “no penalty” isn’t the same as “no disadvantage.” A page built entirely from manufacturer copy gives Google nothing unique to rank it on, which means a competitor with a slightly more detailed, better-structured product description usually wins the position instead.
The same problem shows up on category pages. Thin category copy, missing alt text on product images, and templated titles all signal low effort, even when the products themselves are good. Thin pages don’t just rank poorly. They drive up bounce rate, because shoppers land, see nothing useful, and leave.
Brands need scalable systems for product data, templates, editorial review, and prioritization. High-demand categories and products should receive deeper, original content first rather than spreading limited resources evenly across the entire catalogue.
AI & Changing Search Results
AI Overviews are already cutting into organic CTR, as the data above shows. Shopping and Performance Max ads add more pressure on top of that: industry estimates put Google Shopping ads at more than 75% of U.S. retail paid-search spend, which means a growing share of the page above the fold is already paid before a single organic result even appears.
None of this makes organic search optional. It raises the bar and puts more pressure on brands to provide:
- Accurate and complete product data
- Original reviews, images, and demonstrations
- Clear differentiators
- Consistent brand language and visuals
- Helpful comparison and buying content
- Structured data that search engines can interpret
Brands that show up with strong reviews, clean structured data, and content that actually answers the query are the ones still winning clicks when half the page is ads and AI summaries.

Ecommerce SEO Trends for 2026
The biggest ecommerce SEO trend for 2026 isn’t a single algorithm update. It’s where search is happening at all.
Shoppers are not only typing product keywords into Google. They are asking AI tools for recommendations, comparing products in marketplaces, watching short-form videos, checking reviews, and discovering brands before they ever reach a product page.
Rise of AI Product Discovery
AI is changing product discovery from a keyword-matching exercise into a recommendation and comparison experience.
Google says AI Mode has passed 1 billion monthly users, with queries more than doubling every quarter since launch. Its 2026 Search updates also introduced more agentic shopping features, allowing users to monitor product changes and act on specific criteria.
For ecommerce brands, that changes what “ranking” means.
AI shopping experiences can combine product data, images, pricing, reviews, availability, and attributes into curated product panels or summaries. Google AI Mode can return organized product responses for natural-language prompts, such as a shopper describing the exact type of travel bag they need.
LLM-driven shopping traffic is still small compared with traditional channels, but it is growing.
Adobe Analytics data showing that AI traffic to retail websites increased 138% year over year in May 2026. AI-referred retail visitors also converted at a 54% higher rate and generated 53% more revenue per visit than non-AI visitors.
Retail media networks are influencing search paths, too. EMARKETER forecasts U.S. retail media spend will reach $71.09 billion in 2026, up from $60.32 billion in 2025.
That means more product discovery is happening inside retailer-controlled ecosystems, not only on open search results.
Granular, Hyper-Intent Content Ecosystems
Ecommerce content is moving beyond “category page + product page + blog.”
Shoppers now search with more specific intent. They ask for comparisons, use cases, constraints, price ranges, compatibility, alternatives, and recommendations.
That creates demand for content such as:
- “X vs. Y” comparison pages
- “Best X for Y” buying guides
- Product alternatives pages
- Sizing and compatibility guides
- Gift guides
- Category explainers
- Care and maintenance guides
- Product quizzes
- Interactive recommendation tools
This content does more than capture long-tail traffic.
It gives AI systems, search engines, and shoppers clearer evidence of what your products are, who they are for, and why they should be chosen.
The trend is simple: The more specific the buying question, the more useful your content needs to be.
Strategic Takeaways for Ecommerce Brands
The numbers point to one thing: ecommerce SEO is no longer just about ranking product pages.
It is about building a search system that helps shoppers discover, compare, trust, and buy from your store across multiple surfaces.
Here’s where to focus.
Invest Heavily in Category Pages
Category pages usually carry the broadest commercial intent. They can rank for searches like “men’s running shoes,” “organic dog food,” or “standing desks,” while product pages often compete for narrower model-specific terms.
Treat category pages like revenue pages, not just product grids.
That means adding useful copy, clear internal links, crawlable product listings, filters that do not create indexation chaos, and enough context to help shoppers choose the right product group.
Prioritize Speed + UX
A slow product page does not just hurt performance scores. It gives shoppers time to leave.
Prioritize the pages closest to revenue:
- Category pages
- Product pages
- Site search results
- Filtered listings
- Cart pages
- Checkout flows
The goal is simple: help shoppers see the product, understand the offer, trust the page, and complete the purchase without friction.
Build Scalable Content Systems
Writing one excellent product description is easy. Maintaining thousands of useful product and category pages is the real challenge.
Ecommerce brands need scalable systems for:
- Product descriptions
- Category copy
- Metadata
- Image alt text
- Schema
- Internal links
- Review content
- Out-of-stock and discontinued products
Do not spread effort evenly across every URL. Prioritize high-demand categories, high-margin products, and pages already close to ranking or converting.
Use Ecommerce PPC Data to Refine SEO
Google Ads data can show you which products, queries, landing pages, and messages already convert. Use that intelligence to shape organic strategy.
Look for:
- High-converting paid keywords
- Product terms with strong return on ad spend
- Ad copy with strong click-through rates
- Search terms that reveal comparison or problem-solving intent
- Products that convert well but depend too heavily on paid traffic
PPC gives you fast feedback. SEO turns the winners into longer-term organic assets.
Develop Strong Brand Trust Signals
Shoppers do not buy from rankings. They buy from brands they trust.
That trust is built through:
- Reviews and ratings
- Clear return policies
- Transparent pricing and delivery information
- Verified product details
- Real customer photos and videos
- Secure checkout cues
- Helpful comparison content
- Consistent brand presentation
The more crowded search becomes, the more crucial these trust signals become.
Use UGC and Social Content to Boost Search Visibility
User-generated content gives shoppers proof that product pages alone cannot always provide.
Reviews, customer photos, creator videos, TikTok content, YouTube Shorts, and social proof can support search visibility by strengthening product pages and giving shoppers more confidence before they buy.
This is especially useful for categories where fit, feel, size, taste, performance, or real-world use matter.
Prioritize Structured Data and SERP Feature Optimization
Product data needs to be easy for search engines and AI systems to understand.
Prioritise structured data for:
- Product name
- Price
- Availability
- Reviews
- Ratings
- Images
- Shipping details
- Return policies
- Product variants
Structured data will not guarantee clicks. But without it, your products are less eligible for rich results, merchant listings, product annotations, and AI-assisted shopping experiences.
The brands that win in ecommerce SEO will not be the ones with the most pages. They will be the ones with the clearest, fastest, most trustworthy pages that search engines can understand and shoppers actually want to use.
Wrap-Up & Next Steps
SEO remains one of the highest-ROI channels for ecommerce brands because it compounds.
Paid traffic stops when the budget stops. Organic visibility can continue attracting qualified shoppers long after the initial work is done, as long as the content, technical foundation, and authority are maintained.
AI will change how shoppers discover and compare products. That part is already happening.
But the fundamentals still matter.
Fast pages convert better. Clear category pages help shoppers choose. Reviews build trust. Structured product data helps search engines understand your inventory. Strong brands still earn the click when shoppers have options.
The ecommerce brands that win in 2026 will not treat SEO as a checklist.
They will build systems for visibility across search, AI, marketplaces, social platforms, and every product discovery surface that matters.
Want to know where your store is leaving organic revenue on the table?
Book your free ecommerce SEO strategy call and we’ll show you what to fix first.






















Leave a Reply